Introduction
In today’s data-driven workplace, professionals often find themselves juggling spreadsheets, reports, and databases—searching for insights that can guide decision-making. While Python’s pandas library has long been a favorite for data manipulation and analysis, it requires a fair amount of coding skill. Enter PandasAI—an innovative extension that integrates artificial intelligence into pandas, allowing users to interact with their data through simple, natural-language commands.
Instead of writing complex lines of code, you can now ask questions like “What were the top five products sold last quarter?” and PandasAI will generate and execute the appropriate pandas operations for you. This combination of AI and analytics makes PandasAI a game-changer for office users, analysts, and anyone who regularly works with data.
Uses of PandasAI
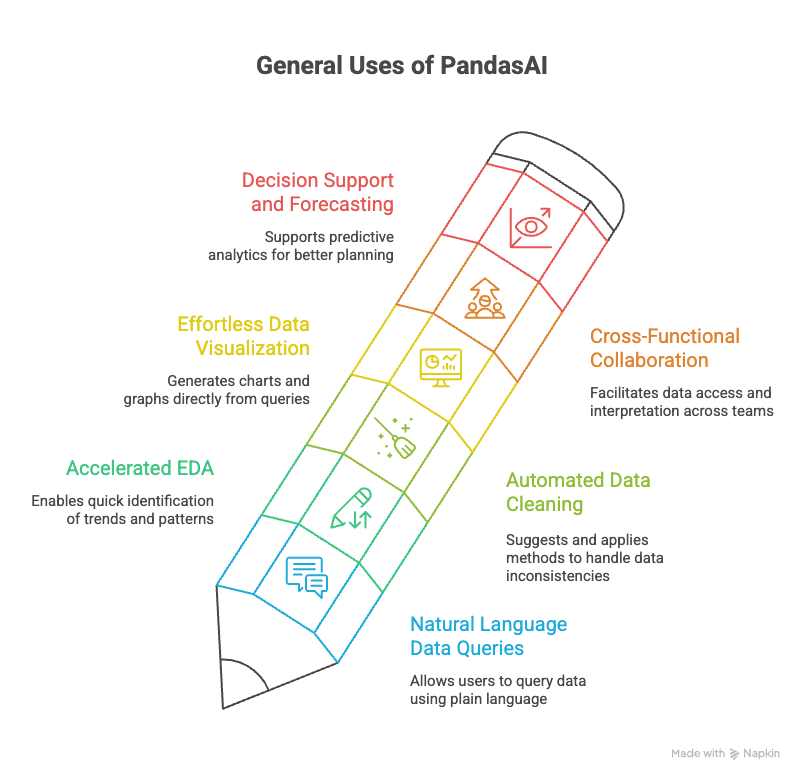
- Natural Language Data Queries:
With PandasAI, users can communicate directly with their data. Instead of recalling specific pandas functions, you can ask plain-language questions such as “Show me the average revenue per region” or “Compare sales for Q1 and Q2.” The AI understands and translates your request into Python code, performs the computation, and returns results instantly. This drastically reduces the learning curve for those less experienced in coding.
- Accelerated Exploratory Data Analysis (EDA):
PandasAI enables faster exploration of datasets. For instance, you can quickly identify trends, outliers, or patterns by simply typing “Which departments had the highest growth rate this month?” This feature is particularly useful for time-sensitive reporting or when making quick business decisions based on emerging data patterns.
- Automated Data Cleaning and Transformation:
Data cleaning can take up to 80% of an analyst’s time. PandasAI can suggest ways to handle missing values, detect anomalies, or even apply corrections automatically. This saves hours of manual work, especially when dealing with inconsistent or incomplete data sources.
- Effortless Data Visualization:
Visual storytelling is a critical part of business communication. PandasAI allows you to request visualizations directly—“Plot total revenue by product category” or “Create a histogram of customer ages.” It automatically generates relevant charts, enabling users to create presentation-ready visuals without switching between tools.
- Cross-Functional Collaboration:
Non-technical users often struggle to interpret raw datasets. PandasAI acts as a bridge between teams by allowing marketing, sales, or operations staff to query data independently and extract insights, reducing reliance on data teams and improving workflow efficiency.
- Decision Support and Forecasting:
PandasAI can also support predictive analytics tasks, helping managers anticipate trends like future sales or expected expenses. When paired with AI models, it becomes a lightweight decision-support system that improves business planning.
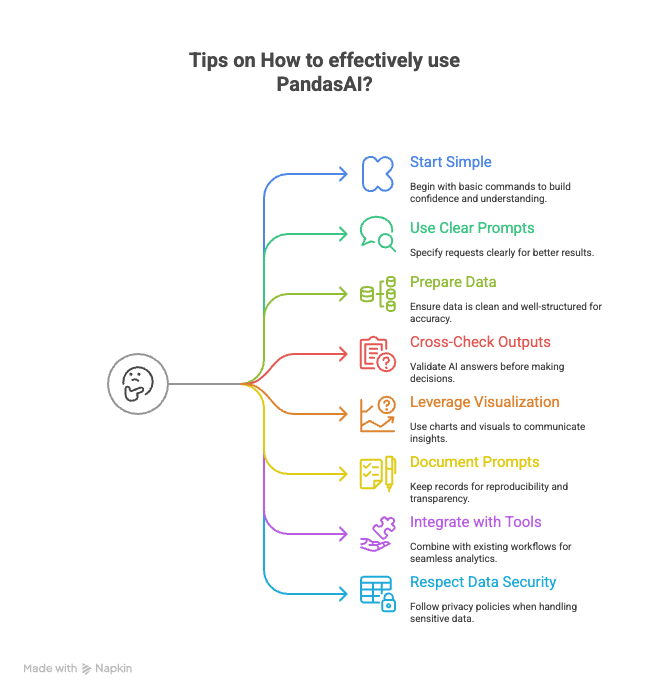
Tips on How to Use It
- Start Simple and Build Confidence: Begin with basic commands to familiarize yourself with how PandasAI interprets your queries.
- Use Clear and Descriptive Prompts: Specify exactly what you want—the clearer your request, the better your results.
- Prepare and Clean Your Data First: Ensure your dataset has meaningful column names and correct data types for best accuracy.
- Cross-Check AI Outputs: Always validate PandasAI’s answers before relying on them for critical decisions.
- Leverage Its Visualization Capabilities: Use generated charts and visuals to communicate insights effectively.
- Document and Save Your Prompts: Keep a record of prompts and results for reproducibility and transparency.
- Combine with Existing Tools: Integrate PandasAI into Excel, Power BI, or Google Sheets workflows for seamless analytics.
- Respect Data Security: Follow your organization’s privacy policies when using PandasAI with sensitive data.
Tools That PandasAI Can Help With
- Excel and Google Sheets Integration: Import and export data seamlessly for enhanced automation.
- Business Intelligence and Reporting: Use PandasAI to preprocess and clean datasets for Tableau or Power BI dashboards.
- CRM and ERP Systems: Quickly analyze customer or resource data for sales trends and efficiency metrics.
- Finance and Accounting Automation: Generate profit summaries and forecasts using simple prompts.
- Human Resources Analytics: Analyze employee performance, turnover, and retention trends efficiently.
- Marketing Campaign Analysis: Evaluate ROI and audience performance across campaigns instantly.
Step-by-Step Guide: How and Where to Use PandasAI
Step 1: Install and Set Up – Install PandasAI using ‘pip install pandasai’. Import pandas and PandasAI, connect your API key, and initialize the AI engine.
“pip install pandasai”
Then in Python, write:
“import pandas as pd
from pandasai import PandasAI
from pandasai.llm.openai import OpenAI
llm = OpenAI(api_token=”YOUR_OPENAI_API_KEY”)
pandas_ai = PandasAI(llm, conversational=False)”
Step 2: Load Your Data – Import your dataset from a CSV or Excel file using pandas. Ensure your columns are properly labeled.
“df = pd.read_csv(“sales_data_q3.csv”)”
Step 3: Ask a Simple Question – Prompt PandasAI with a query like “What is the average revenue by region?” It will return the correct result automatically.
“result = pandas_ai.run(df, prompt=”What is the average revenue by Region?”)
print(result)”
Step 4: Request a Visualization – Ask for a visual summary, for example, “Plot a bar chart of average revenue by region.”
“res_plot = pandas_ai.run(df, prompt=”Plot a bar chart of average revenue by Region, with colors by CustomerSegment.”)”
Step 5: Perform Data Cleaning Tasks – Ask PandasAI to fill missing values or summarize grouped data effortlessly.
“clean_df = pandas_ai.run(df, prompt=”Fill missing values in UnitsSold with the median, then show me total units sold by CustomerSegment.”)”
Step 6: Combine Multiple Datasets – Analyze data across different sources by asking multi-table queries.
Step 7: Apply It in Your Workflow – Use PandasAI for recurring reports, ad-hoc analyses, or data validation before meetings.
Suppose you have sales_df, customer_df, and region_df.
Then Write:
“combined_result = pandas_ai.run([sales_df, customer_df, region_df],
prompt=”Which regions had the highest repeat purchases by premium customers in the last 12 months?”)”
Conclusion
PandasAI redefines how professionals interact with data. By merging natural language input with pandas’ analytical power, it opens new possibilities for faster insights and efficient workflows. Whether you’re a data analyst, manager, or project lead, PandasAI helps automate repetitive tasks and enables informed decision-making. Used responsibly and with human oversight, it can transform how your organization handles data and analytics.
References
- ARTiBA. (2024). Exploring PandasAI: Key features and practical applications. Retrieved from https://www.artiba.org/blog/exploring-pandas-ai-key-features-and-practical-applications
- DataCamp. (2024). An introduction to PandasAI. Retrieved from https://www.datacamp.com/blog/an-introduction-to-pandas-ai
- GeeksforGeeks. (2024). PandasAI – The generative AI Python library. Retrieved from https://www.geeksforgeeks.org/pandas-ai/
- PandasAI Documentation. (2024). PandasAI official documentation. Retrieved from https://docs.pandas-ai.com/v3/introduction
- Sinaptik AI. (2024). PandasAI GitHub repository. Retrieved from https://github.com/sinaptik-ai/pandas-ai
- Alamuram, M. (2024). Introduction to PandasAI. Medium. Retrieved from https://medium.com/@mail2alamuram/introduction-to-pandas-ai-365b7bf0beb1
Author
Nafiz Imtiaz